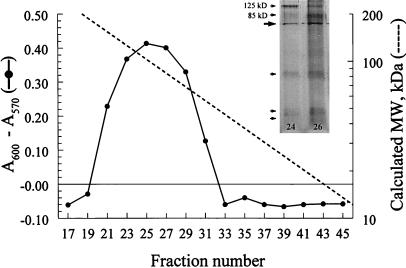
Figure 1.
Fractionation of cryptococcal proteins by size-exclusion chromatography. Supernatants from disrupted C. neoformans were applied to a calibrated Sephacryl S-200 column, and alternating fractions were tested for their capacity to stimulate the hybridomas to produce IL-2 in the presence of APC. A600–A570 represents reduction of alamarBlue by CTLL-2 cells (a direct measure of hybridoma IL-2 production). Absorbance (A600–A570) values for 0, 0.01, 0.1, and 1 units/ml of IL-2 standard were −0.073, 0.112, 0.234, and 0.385, respectively. Dotted line represents calculated molecular mass based on peaks obtained with molecular mass standards. Fraction 25, which had peak activity, had an estimated molecular mass of 102 kDa. Results are representative of five column runs. (Inset) Column fractions 24 and 26 were concentrated, separated by SDS/PAGE, and silver-stained. Two bands were seen with apparent molecular masses of ≈85 and 125 kDa. The large arrow points to a nonspecific band. The small arrows point to lower molecular mass bands.

