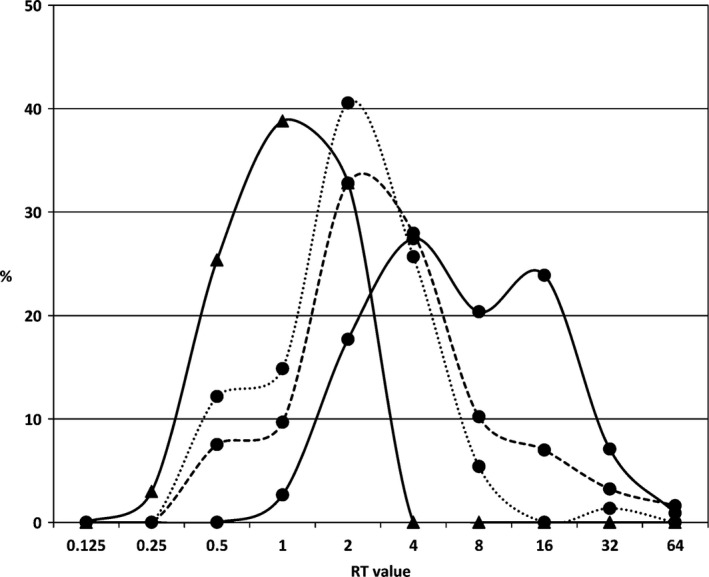
Figure 5.

Distributions in percentage of ratio between EBHSV titre/RHDV2 titre (RT value) calculated for each serum belonging to the four epidemiological groups studied. The four curves represent the distributions in percentage of the RT values obtained by dividing the EBHSV cELISA titre with the RHDV2 cELISA titre for each serum belonging to a specific group. We did not include the sera that were negative to both ELISAs, which would have abnormally increased the category RT 1. Lines with circles (●) correspond to hare sera taken in Italy and triangles (▲) to hare sera from Spain. Black line (—): sera belonging to the pre‐RHDV2 group taken between 2007 and 2010; dot line (…): sera collected during 2012; dashed line (– –): sera collected during 2013. Category with ratio “1” does not include the sera that were negative to both ELISAs. In order to include in the analysis also the sera that were negative at one cELISA but positive to the other, we attributed to negative sera the formal value of 1/5. Therefore, for a serum negative on the RHDV2 cELISA but with a titre of 1/20 on the EBHSV cELISA we assigned a RT value of 4.
