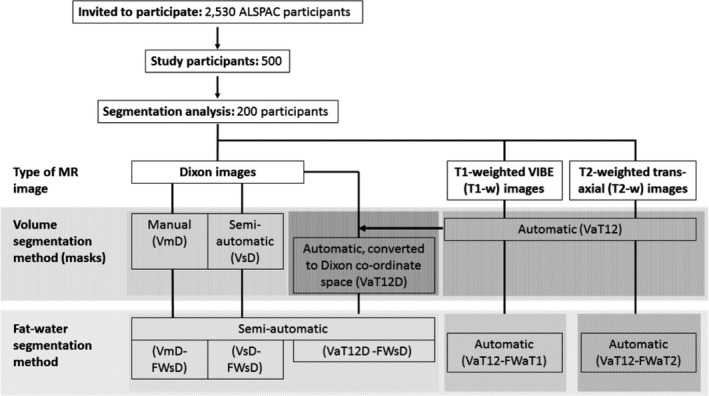
Figure 1.

Flow diagram of the overall data processing chain and nomenclature for the various segmentation methods. Some of these have the potential to operate on different source data and we can also combine the methods in different ways to achieve an overall result. We thus assign each step three codes: segmentation purpose (V = breast volume, FW = fat–water); degree of automation (m = manual, s = semi‐automatic, a = fully automatic); and source data (D = Dixon; T1 = T 1‐weighted, T2 = T 2‐weighted, T12 = uses both T 1‐ and T 2‐weighted data). Thus, a breast‐volume measurement using semiautomatic segmentation on original Dixon data would be represented as VsD. Fat–water segmentations require both source data and a previously generated volume mask, so are represented by the combination of two codes. For instance, fat–water statistics calculated semiautomatically from Dixon source data and using a mask generated automatically from T1w and T2w data would be described by VaT12‐FWsD. We note one additional case, in which the volume mask VaT12 is re‐sampled to give a result in the same coordinate space as the Dixon images and we assign this the label VaT12D.
