
Figure 7.
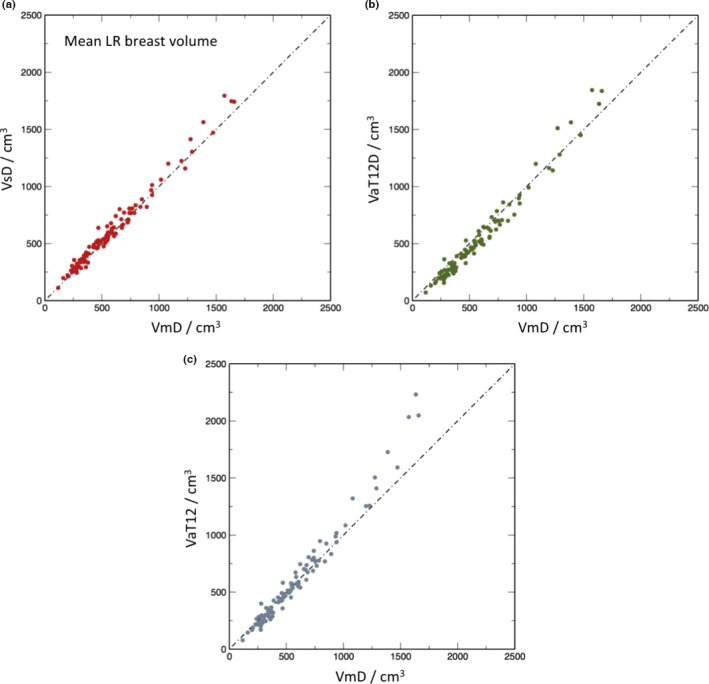
Scatter plots of mean left and right breast volumes in cm3 for the different methods in comparison to manual segmentation: (a) volume from semiautomatic segmentation of Dixon images (VsD) vs. volume from manual segmentation (VmD); (b) volume via automated segmentation from T1‐ and T2‐weighted images transformed to Dixon reference frame (VaT12FD) vs manual (VmD); (c) volume obtained from T1‐ and T2‐weighted images in native 3‐D reference frame (VaT12). [Color figure can be viewed at wileyonlinelibrary.com]