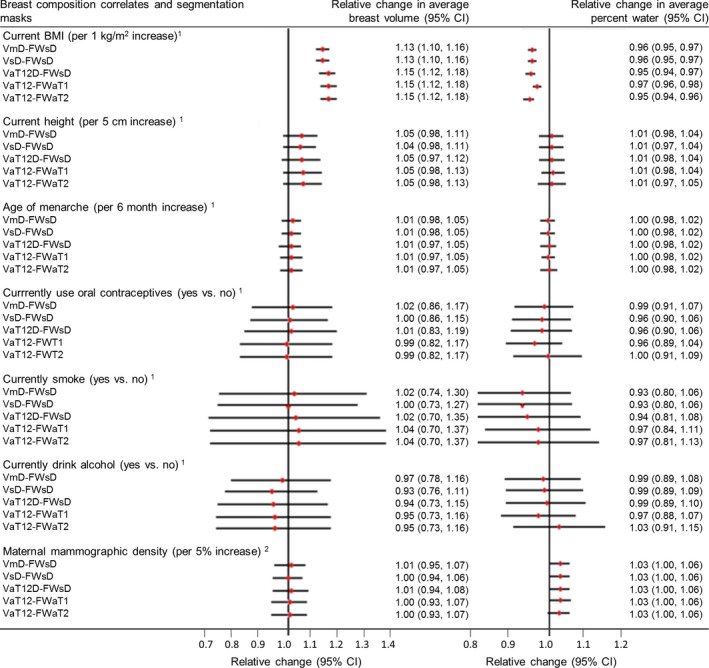
Figure 10.

Results of epidemiological analysis. Relative change in geometric means of MR breast volume and percent water in relation to a unit increase, or category change, in each breast composition correlate variable. 1Models adjusted for current age in months and BMI at MR scan, where appropriate. 2Models restricted to young women for whom mammograms from their mothers could be retrieved (n = 33) adjusted for current age in months and BMI at MR scan and maternal age at mammogram and BMI in 2010 (median = 3y (IQR = 1.5y) prior to mammogram). For further details, see Supplementary Information. [Color figure can be viewed at wileyonlinelibrary.com]
