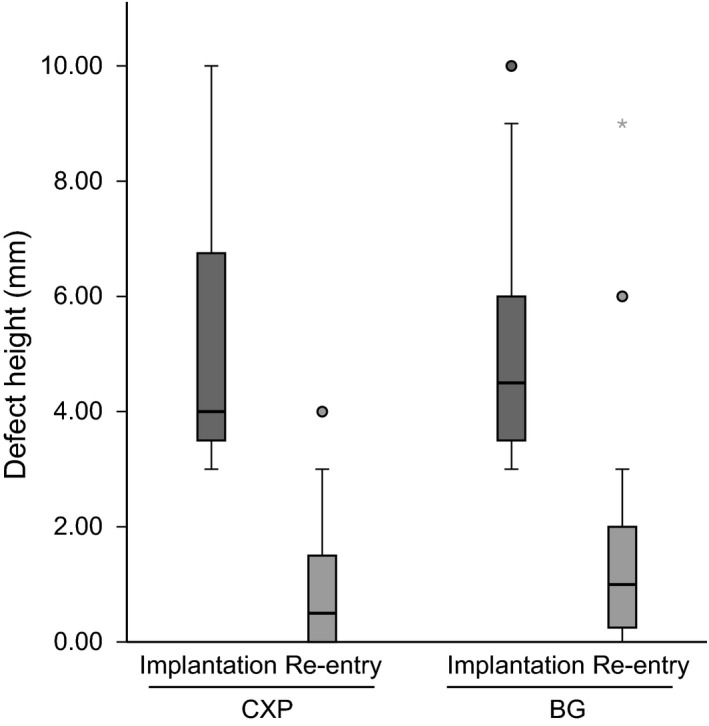
Figure 4.

Changes in defect height from implantation to reentry surgery, performed after a 6‐month healing period, in the CXP and the BG arms. The boxes indicate quartile distributions, with the top of the box indicating the upper quartile (75%), the bottom of the box indicating the lower quartile (25%), and the middle line indicating the median. Circles denote outliers farther than 1.5 interquartile ranges but closer than 3 interquartile ranges. The star denotes the outlier farther than 3 interquartile ranges.
