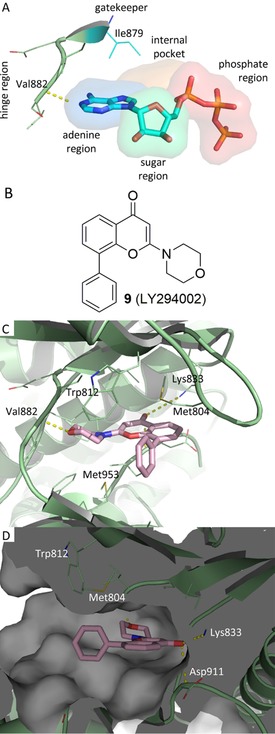
Figure 3.

X‐ray structures of pig PI3Kγ in complex with a) ATP (PDB ID: 1E8X) and c, d) 9 (PDB ID: 1E7V). b) 2 D structure of 9. Protein is shown in pale‐green cartoon; ligands atoms are shown as sticks. Hydrogen‐bonding interactions are plotted as yellow dotted lines. The 9–protein complex is shown from two different points of view: b) front and c) side.
