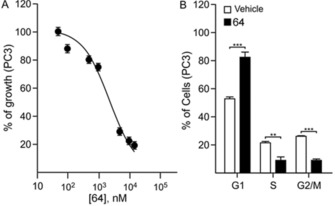
Figure 10.

Compound 64 decreased proliferation and induced cell‐cycle arrest. a) Proliferation curve of PC3 cells. Cell proliferation was analyzed by using MTT cell‐proliferation assay kits. The growth was calculated as the percentage of the untreated control and a dose–response curve was generated by plotting the percentage of growing cells versus the logarithm of inhibitor concentration. The curve represents the average of three independent experiments. b) PC3 were treated with 10 μm 64 for 48 h. At the end of treatment, cells were washed with 1× phosphate‐buffered saline and were stained with propidium iodide. The percentage of cells in the G1/G0, S, and G2/M phases was determined by flow cytometry. Columns represent the mean of three independent experiments; bars represent the SEM; **p<0.01, ***p<0.001.
