Figure 1.

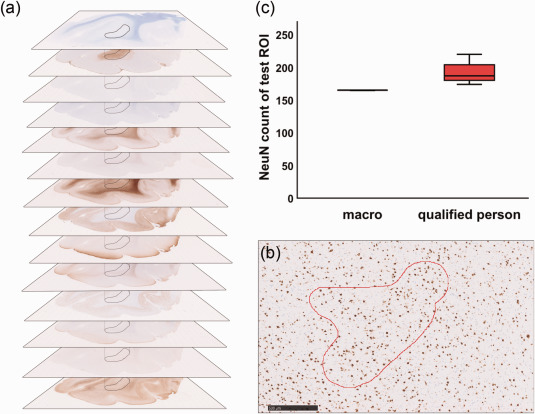
Macro validation. a Immunohistochemical digital slide stack, black = region of interest (ROI), kept constant during individual stainings. b NeuN staining, red = test ROI for macro validation, scale bar = 500 µm. c Statistical analysis of macro validation. 10 individual macro runs were compared to counts of 10 individual qualified persons.
