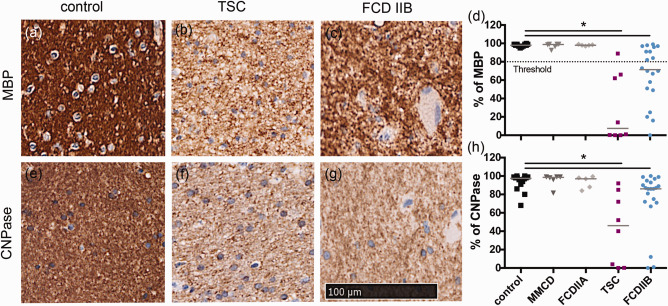
Figure 2.

Quantification of myelin pathology shown via % of positive MBP staining in various malformations of the cortical development versus control. Threshold differentiates between normal and hypo‐myelination (80%). a–c white matter MBP staining, d ROI quantification. e–g white matter CNPase staining, h quantification. Scale bar = 100 µm counts for all IHC pictures.
