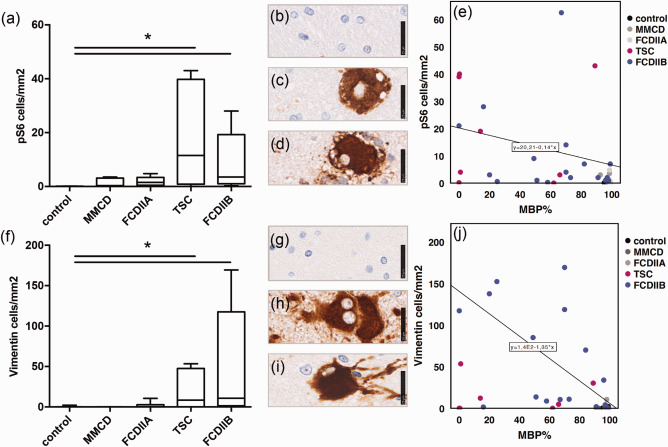
Figure 3.

Myelination and mTOR. a Cell number from ROI based quantification of pS6. b IHC staining of pS6 in control white matter, c in balloon cells (FCD IIB), d giant cells (TSC), scale bar = 25µm. e Correlation of pS6 positive cells and MBP. f Cell number from ROI based quantification of vimentin. g IHC staining of vimentin in control white matter, h in balloon cells (FCD IIB), i giant cells (TSC), scale bar = 25 µm. j Correlation of vimentin positive cells and MBP.
