Figure 5.

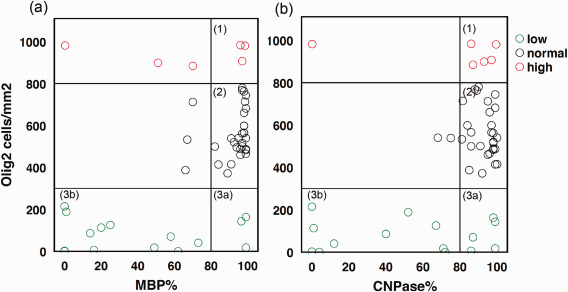
Oligodendrocyte subpopulations in MCDs. Cell number from ROI based quantification of Olig2 and myelin content in %. a MBP staining versus Olig2 positive cells/mm2. b CNPase staining versus Olig2 positive cells/mm2. Sector 1 indicates cases with reactive oligodendroglial hyperplasia and normal myelin content, sector 2 cases with normal myelin and oligodendrocyte numbers and sector 3 burnout of oligodendroglia either with normal myelin levels (3a) or with severe cell and myelin loss (3b).
