Figure 3.

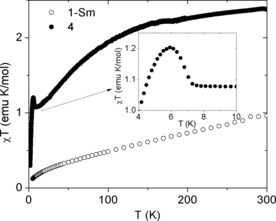
The dc magnetic susceptibility χ as a function of temperature (plotted as χT vs. T) of 1‐Sm (○) and 4 (•). The inset shows the increase in χT with decreasing temperature between 8 and 6 K.

The dc magnetic susceptibility χ as a function of temperature (plotted as χT vs. T) of 1‐Sm (○) and 4 (•). The inset shows the increase in χT with decreasing temperature between 8 and 6 K.