
Figure 2.
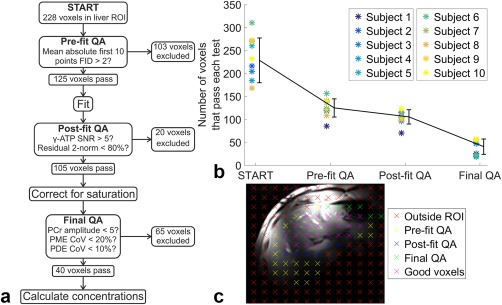
a: The decision tree of quality assurance (QA) tests for excluding voxels in the analysis of the CSI grid of the liver. The mean number of voxels remaining at each step are given. b: The number of voxels that pass each test. The black line shows the mean ± SD of the values. The stars show individual values, with each color representing a different subject. c: The locations of a single slice of CSI voxels overlaid on a 1H localizer. Each color indicates a different exclusion parameter.