Figure 4.

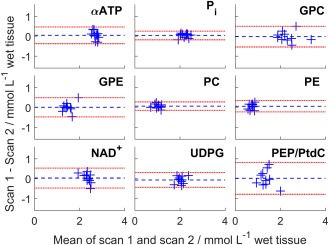
Bland‐Altman plots of the concentrations of the two repeatability scans. Each blue cross marks a different subject. The blue dashed line is the mean difference and the red dashed line is 1.96 × SD, i.e., the 95% confidence interval.

Bland‐Altman plots of the concentrations of the two repeatability scans. Each blue cross marks a different subject. The blue dashed line is the mean difference and the red dashed line is 1.96 × SD, i.e., the 95% confidence interval.