
Figure 3.
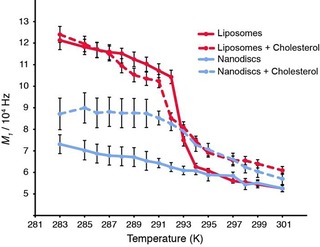
Thermal variation of the first spectral moment (M 1) of [D54]DMPC, as determined from solid‐state 2H NMR spectra for liposomes (red) and nanodiscs (blue) in the presence (dashed lines) and absence (solid line) of cholesterol. Spectra have been acquired from 283 to 301 K and analysed with NMR‐DePaker [1.0rc1 software (Copyright (C) 2009 Sébastien Buchoux)] software to extract the M 1 value for each temperature.