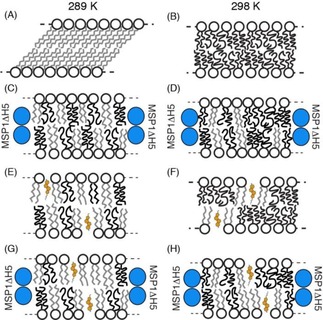
Figure 5.

Cartoons representing lipid dynamics at two temperatures (289 and 298 K) for liposome (A, B, E and F) and nanodisc (C, D, G and H) membrane systems. Different results obtained by solid‐state NMR spectroscopy for DMPC are summarised. The MSP1ΔH5 protein helices are represented as blue circles and acyl chain dynamics are indicated in black (for fast motions) and grey (for slow motions). Cholesterol is displayed in orange and the number of sterol molecules is in agreement with the DMPC/cholesterol molar ratio.
