Figure 6.

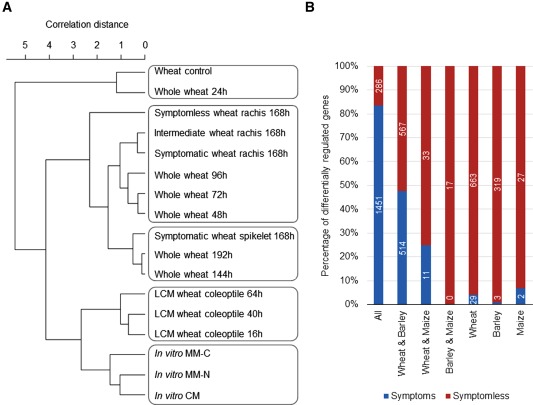
Genome‐wide comparative analyses of Fusarium graminearum gene expression during wheat, barley and maize infection. (A) Dendrogram of the genome‐wide correlation distance (complete linkage) between the presented F. graminearum infection phase‐specific transcriptome isolated from symptomless and symptomatic wheat tissues at 7 days post‐infection (dpi) (168 h), with pre‐existing in vitro (Gueldener et al., 2006) and in planta datasets, including whole wheat heads (complete time course) and laser‐capture micro‐dissection (LCM) wheat coleoptiles (Lysoe et al., 2011; Zhang et al., 2012) (available from PlexDB). It should be noted that the transcriptional profiles of early and late wheat head infection are simultaneously linked to the phenotypically distinct symptomless and symptomatic tissues within the single 7‐dpi time point. CM, complete medium; MM‐C, minimal medium without carbon; MM‐N, minimal medium without nitrogen. (B) The distribution of the previously reported host species‐specific and commonly expressed F. graminearum genes (Soanes et al., 2008) within the genes with increased transcript abundance in the symptomless and symptomatic wheat rachis tissue at 7 dpi. The increased percentage of reported host‐specific genes in symptomless wheat tissue should be noted.
