
Figure 1.
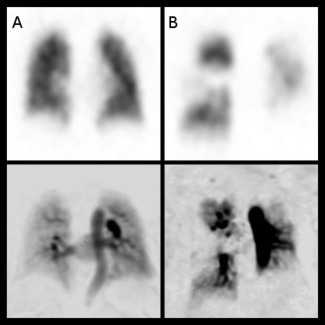
Matched slices from 3D coronal SPECT perfusion images (top row) and DCE MR perfusion images (bottom) in a patient with normal lung perfusion (A) and with CTEPH (B). This shows the typical wedge‐shaped perfusion defects (arrows) in the right mid, left lower, and left upper zones on the MR and the SPECT imaging of patient B. Note the images are presented on an inverse gray scale as reviewed clinically.