Figure 3.

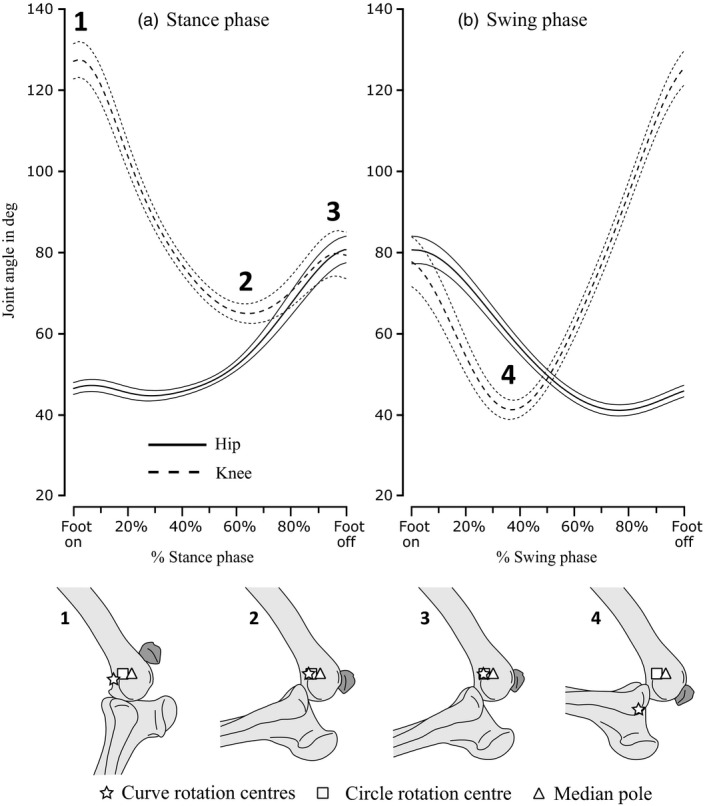
Upper subfigure shows mean joint angles (see Kambic et al., 2015) averaged from time‐normalized data from all recorded strides for the hip (solid) and knee (dashed) joints, plotted against percentage stance and swing phases. Values one standard deviation ± from the mean value (thick lines) are shown as thinner lines in the same format. Lower subfigure shows patella position relative to the knee at the minima and maxima of knee angles numbered 1–4 on the upper subfigure, with estimated positions of rotation centres shown for the curve‐fit (start), circle‐fit (square) and median‐pole (triangle) methods.
