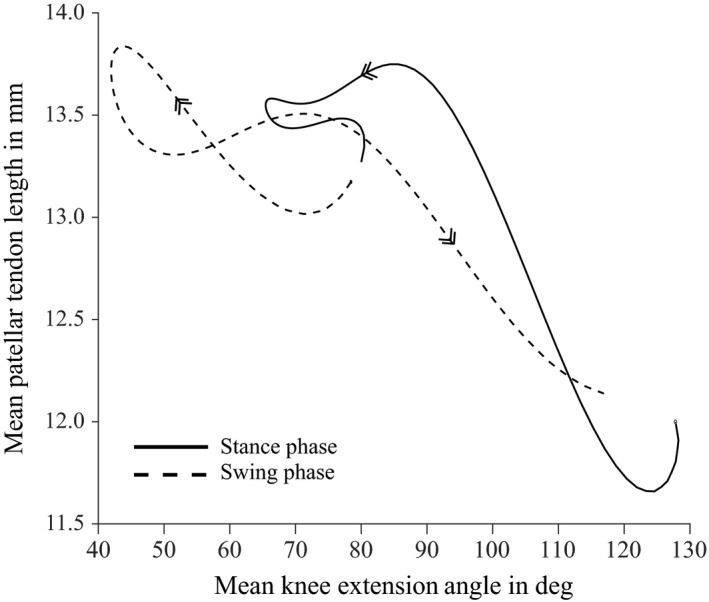
Figure 6.

Mean values of patellar tendon length (averaged from time‐normalized data from all recorded strides) plotted against mean knee extension angle (averaged in the same way). Data from stance phases are shown as thick, solid lines, and data from swing phase are shown as thinner, dashed lines. Arrows on each curve indicate progression from stance to swing.
