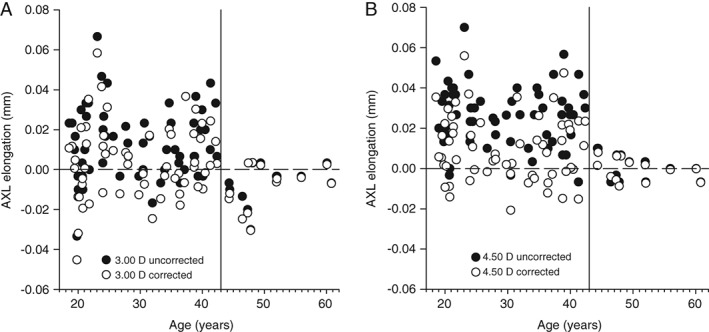
Figure 3.

Corrected axial length changes (open circles) at 3.00 D (A) and 4.50 D (B) accommodative stimulus levels. Uncorrected raw axial length (filled circles) values are also presented to demonstrate the difference in magnitude between the corrected axial length values reported in this study and the uncorrected raw axial length values. The dashed horizontal line represents no change in axial length (0.00 mm). The solid vertical line divides the group at age 43 years, highlighting the reduction in variance among the older participants.
