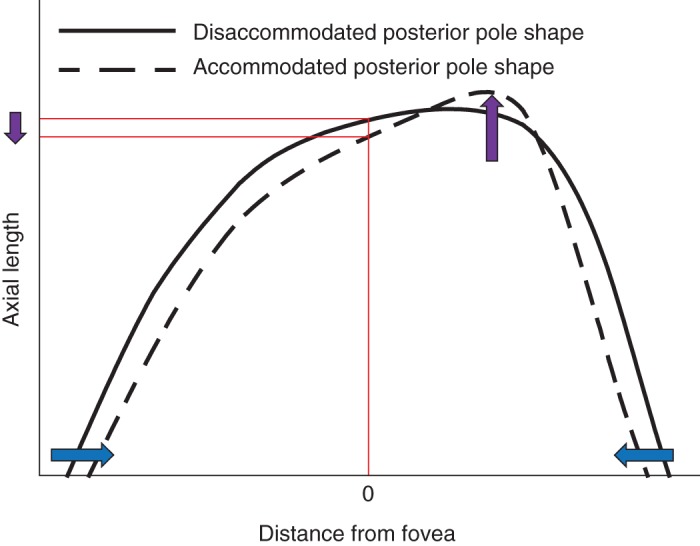
Figure 4.

Diagrammatic representation of the hypothesised shape of a disaccommodated (solid line) and accommodated (dashed line) posterior pole. The x‐axis describes the distance from the fovea and the y‐axis describes the distance of the posterior pole from the cornea. The blue arrows demonstrate the putative accommodation‐driven inward movement at the equator and the purple arrows show the potential corresponding pattern of posterior pole elongation. In this scenario, the axial length measured at the central fovea appears to have decreased during accommodation.
