
Figure 2.
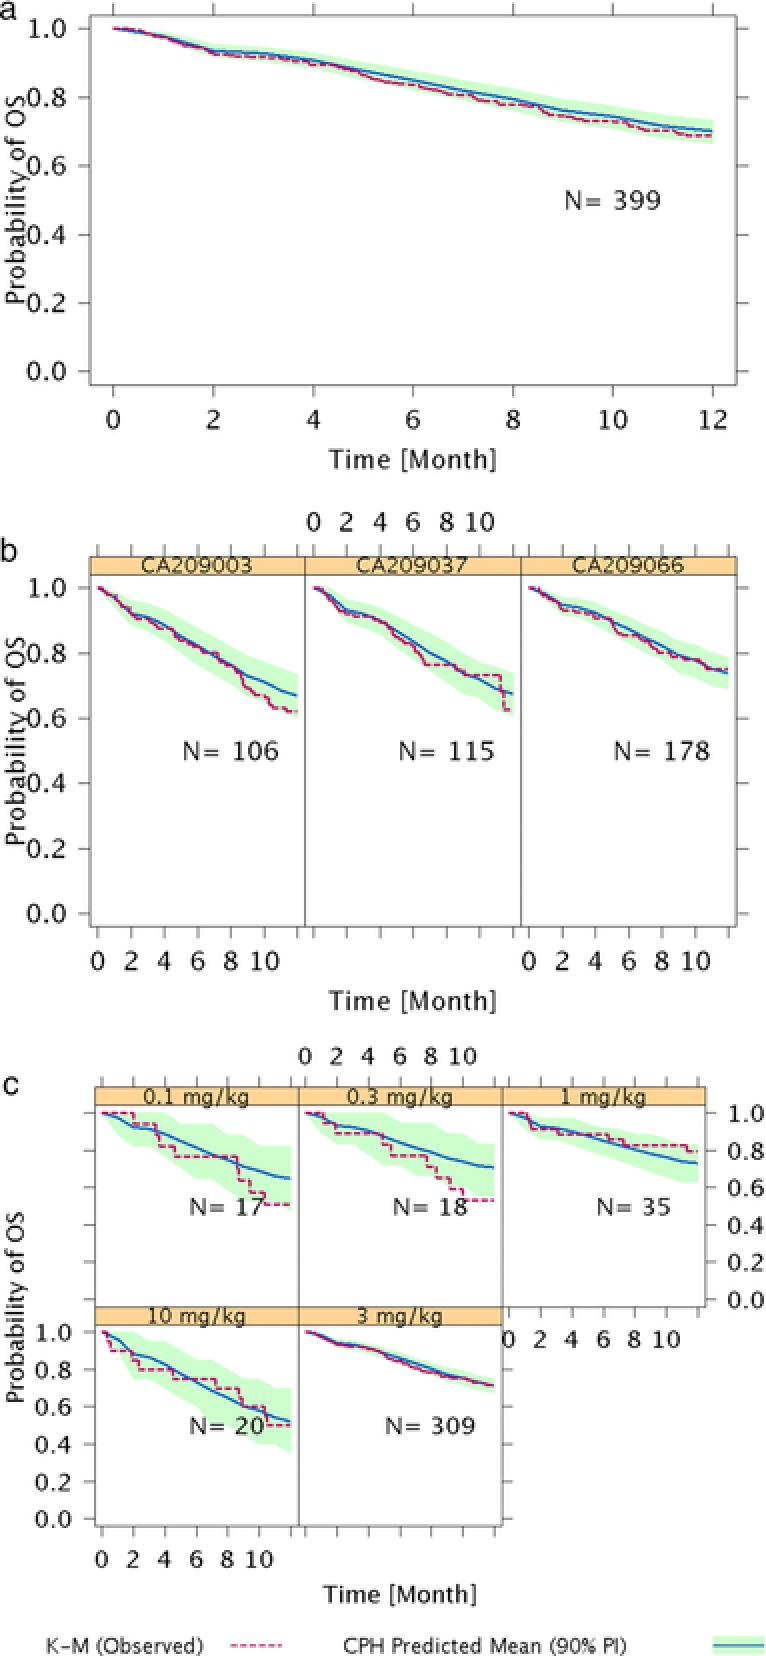
Model evaluation of exposure–response analysis of overall survival in (a) overall population, (b) each study, and (c) at different doses of nivolumab. CPH, Cox proportional‐hazards; K‐M, Kaplan‐Meier; OS, overall survival; PI, prediction interval.