Figure 4.

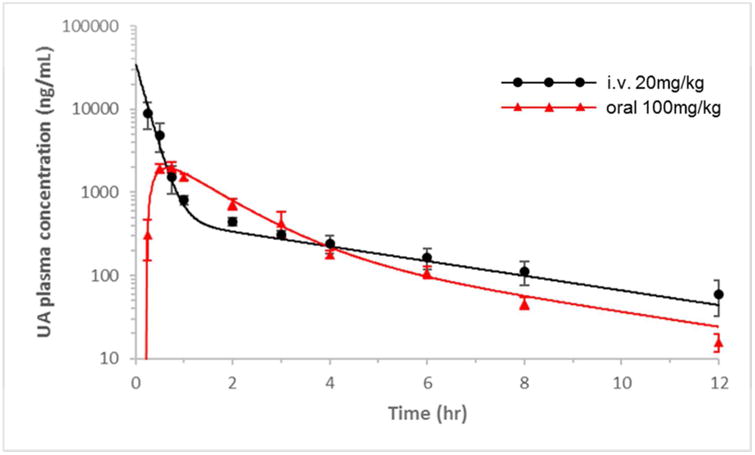
UA plasma pharmacokinetics as described by the two-compartment model. Experimental observations are shown as the mean ± SD. The solid line represents the model prediction for the 20 mg/kg i.v. dose and 100 mg/kg oral dose of UA.

UA plasma pharmacokinetics as described by the two-compartment model. Experimental observations are shown as the mean ± SD. The solid line represents the model prediction for the 20 mg/kg i.v. dose and 100 mg/kg oral dose of UA.