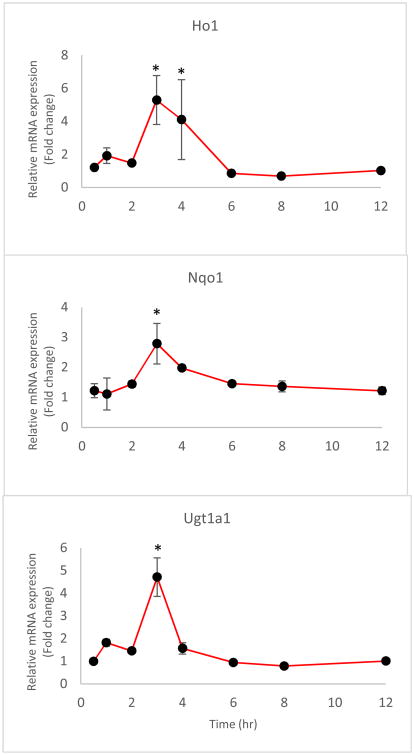
Figure 7.
Changes in the anti-oxidant phase II gene levels, including Ho1, Nqo1, and Ugt1a1, after the oral administration of 100 mg/kg UA. The data are presented as the mean ± SD of the observed data in rat leukocytes. * The difference was statistically significant when p < 0.05 compared with the first time point.

