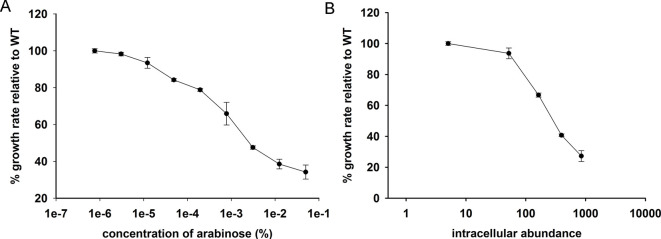
Figure 1. Representative gene-dosage toxicity curves for E. coli Dihydrofolate Reductase (DHFR) expressed from pBAD-plasmid .
( Bhattacharyya et al., 2016 ). A. Plot of relative growth rate as a function of arabinose concentration; B. Plot of relative growth rate as a function of intracellular abundance of DHFR protein.

