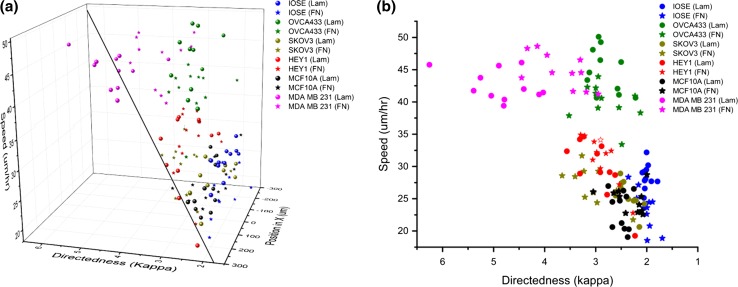
Figure 7.
Combined migration metrics of cell lines on LN and FN bi-gradients. (a) is a 3D plot of migration speed and directedness as a function of protein concentration for all the cell lines. The blue plane delineates the linear trend in directedness and migration speeds. (b) is a 2D side view displaying relation between cell speed and directedness as a function of cell type.

