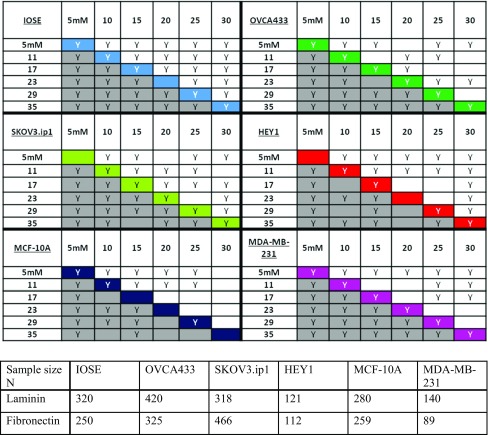
Table 2.
(Top) Watson U 2 Test for the f-actin distribution. The grey boxes represent cells on FN gradients and the top half represents cells on LN. The letter “Y” indicates statistical significance at p < 0.05 and blank indicates no significant difference. The color coded diagonal compares migration speed of cells on FN j. LN only at the relatively same segment of protein concentration. (bottom) Number of cells analyzed in each case.

