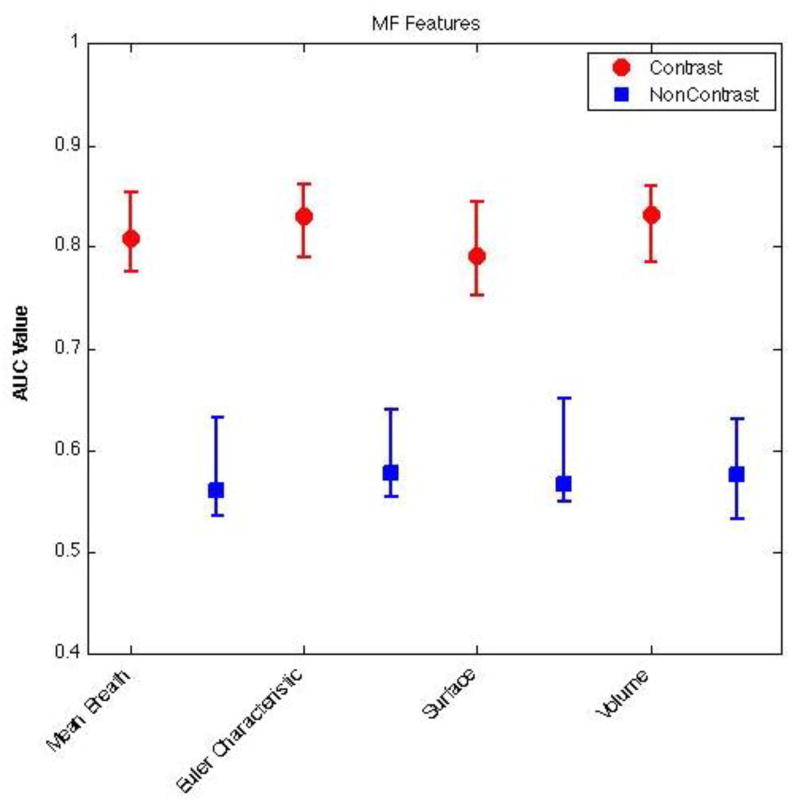
Figure 2.
Classification performance of Minkowski Functionals extracted from pre-contrast (blue) and contrast-enhanced (red) CBCT images. For each distribution, the central mark corresponds with the median and the edges are the 25th and 75th percentile. As seen here, Minkowski Functionals extracted from contrast-enhanced CBCT images are significantly better at distinguishing between lesion and non-lesion regions (p < 0.05).

