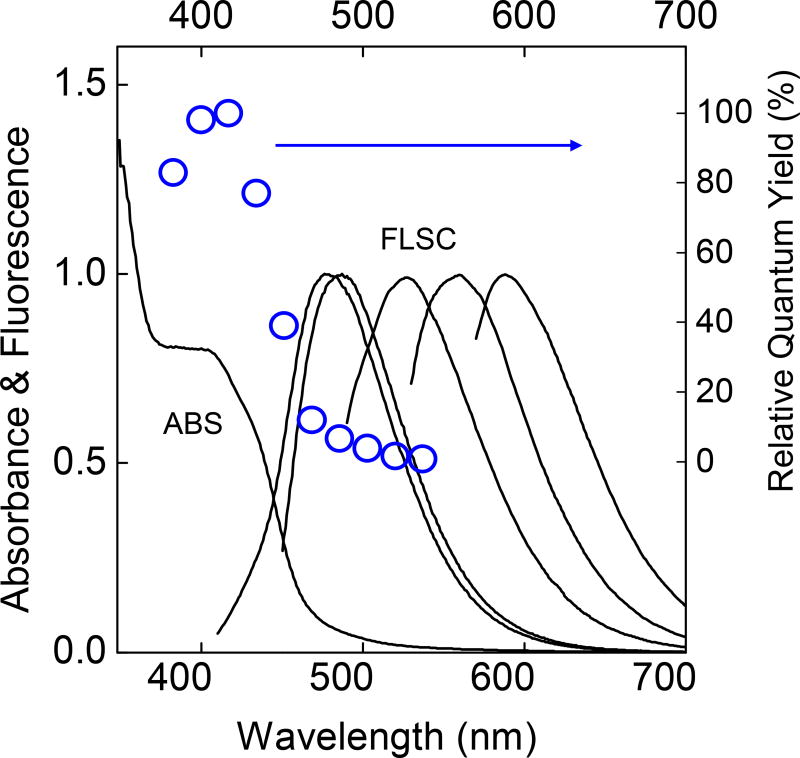
Figure 6.
Absorption (ABS) and fluorescence (FLSC, with corresponding excitation wavelengths from left to right: 400 nm, 440 nm, 480 nm, 520 nm, and 560 nm) spectra of a representative sample of the PEI/CA-CDots in aqueous solution, and the fluorescence quantum yields at a series of excitation wavelengths (○, relative to that at 420 nm excitation).

