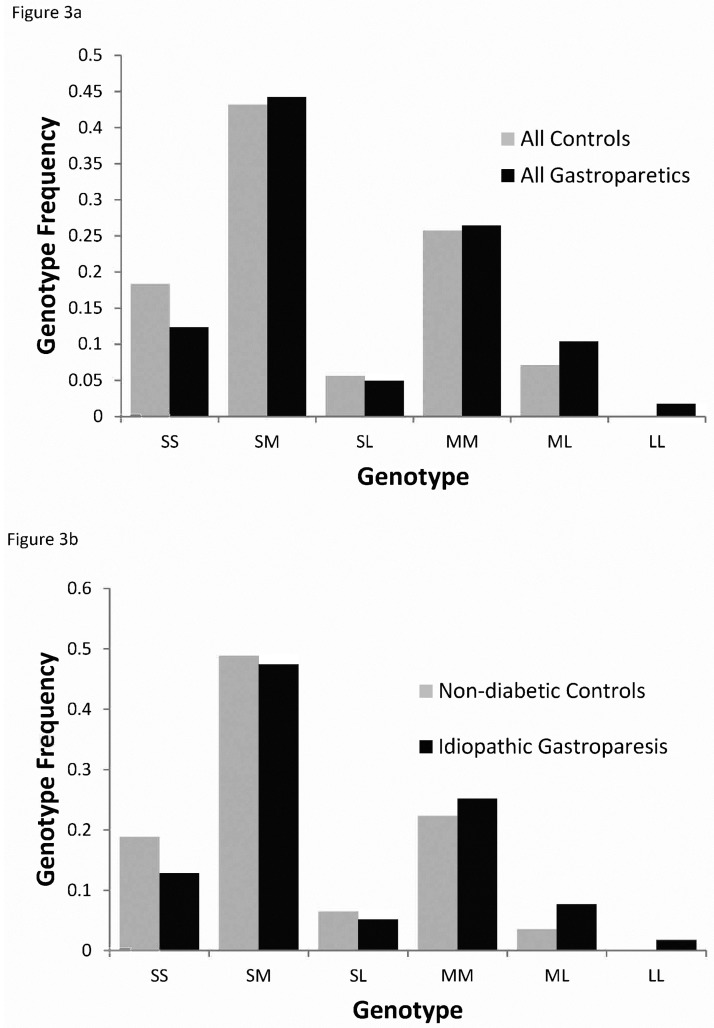
Fig 3. Allele distribution in gastroparetic and control subjects.
Allele distribution of long (L), medium (M) and short (S) alleles a) for subjects with gastroparesis is significantly different from the distribution for control subjects (Chi2 P value = 0.019) and b) for subjects with idiopathic gastroparesis compared to non-diabetic controls (Chi2 P value = 0.049). Short alleles were defined as shorter than 29 polyGT repeats and long alleles were defined as longer than 32 repeats (see Fig 1a for definition).

