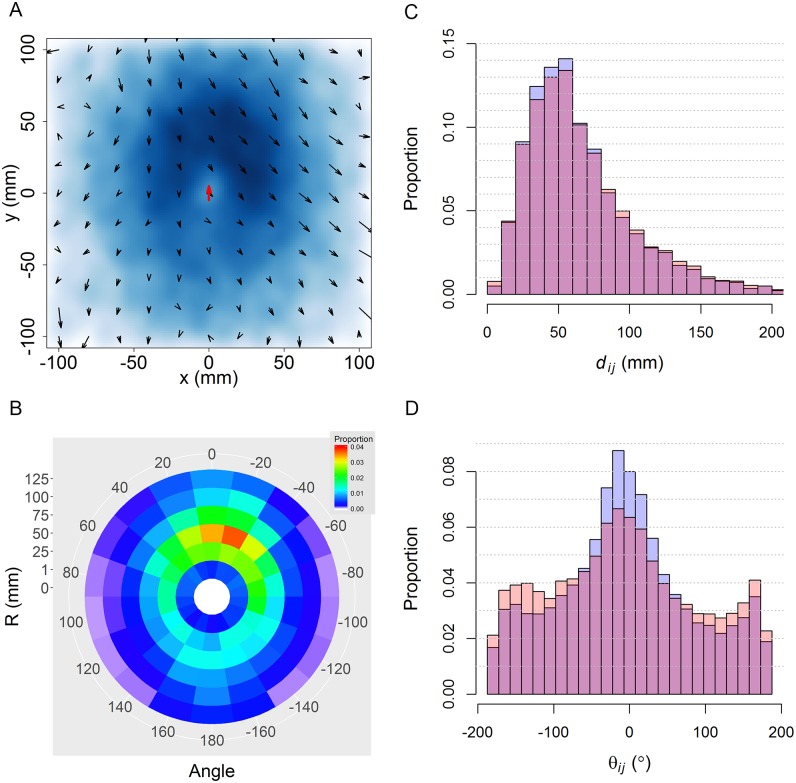
Fig 10. Spatial and velocity distribution of influential neighbors around a focal fish in groups of 5 individuals.
(A) Density map of influential neighbors’ location (blue) and their average relative velocity field (arrows) with respect to the focal fish (red arrow). (B) Average spatial distribution of influential neighbors in polar coordinates (red: highest frequency; dark blue: low frequency; white: frequency equals zero). (C) and (D): Distributions of the distance dij and the angle of exposure θij respectively. Blue histograms: Fj is an influential neighbor of Fi; orange: Fj is a neighbor of Fi, not necessarily influencing Fi; dark pink: overlap between the two.

