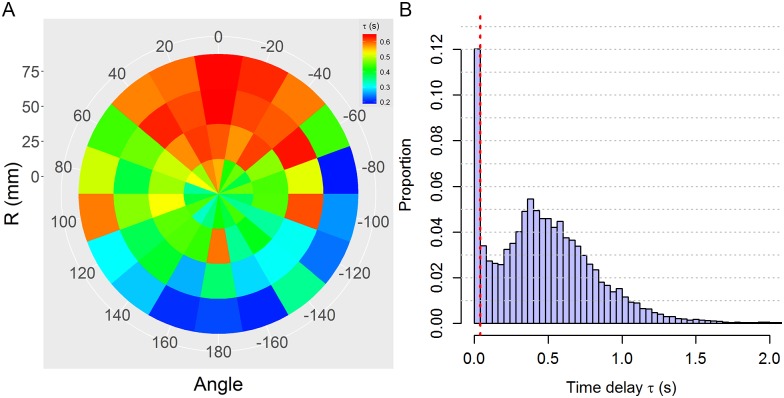
Fig 13. Distribution of time-delay τ.
(A) Spatial distribution of time-delays obtained by selecting the maximum of the pairwise correlation between the focal fish and its neighbor. The color of each bin represent the mean value of all the cases in that bin. An angle of 0° degree corresponds to when the influential neighbor is in front of the focal individual. (B) Spatially integrated distribution of time-delays. The data here are the same as those used in panel A. The dotted line corresponds to the reaction time threshold τR = 0.04s.

