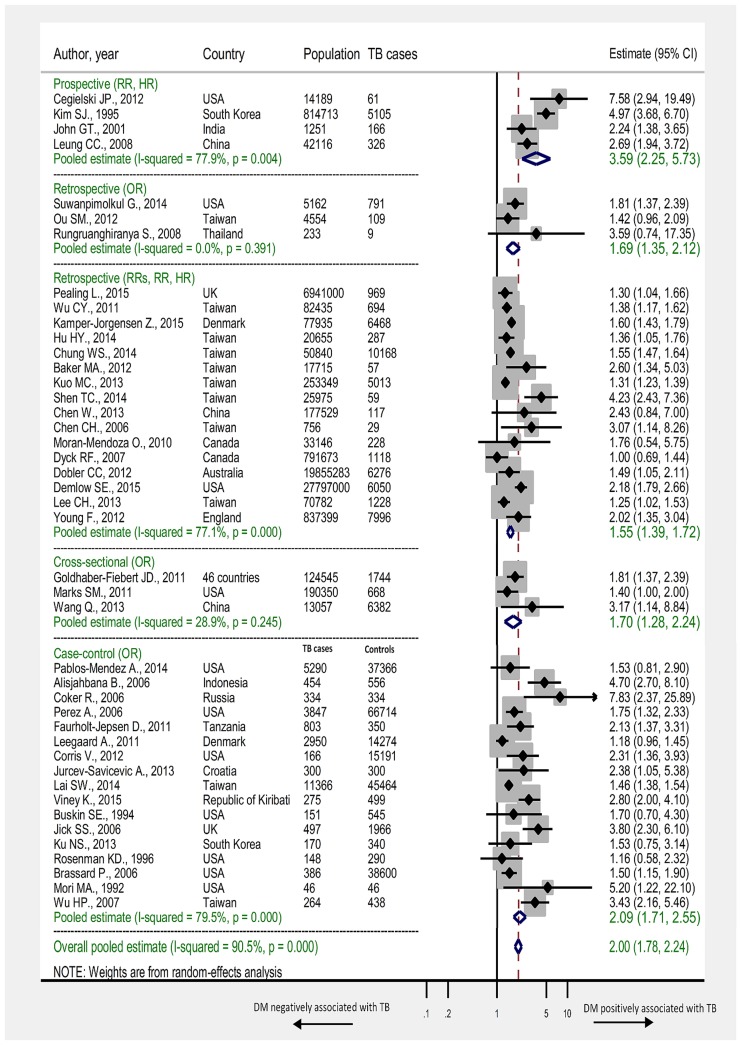
Fig 2. Forest plot of the meta-analyses.
Pooled findings of 44 studies reporting adjusted estimates of the association between TB and DM, stratified according to study design. Size of the square is proportional to the precision (weight) of the study-specific effect estimates. Circle is the study–specific effect point estimate. Arrows indicate that the bars are truncated to fit the plot. The diamond is centered on the summary effect estimate, and the width indicates the corresponding 95% CI. RRs: relative risk; RR: rate ratio; OR: odds ratio; HR: hazard ratio.

