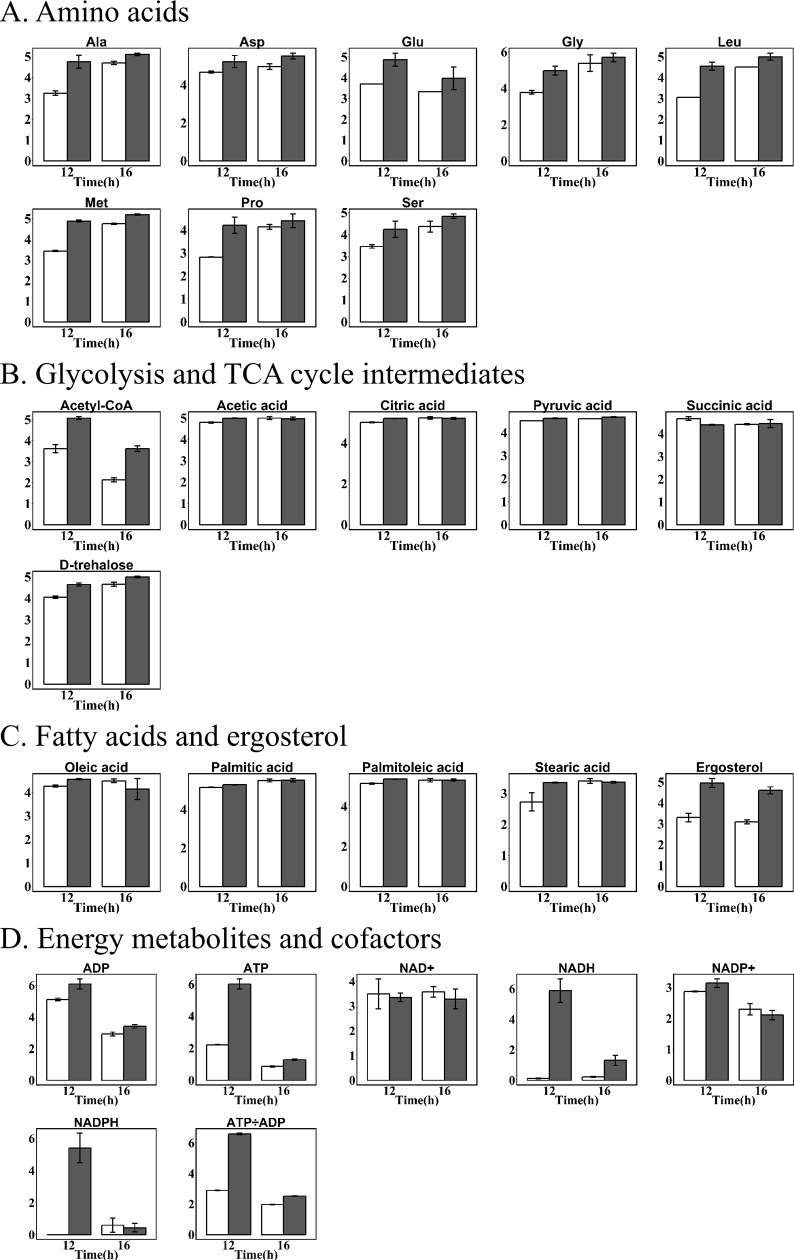
Fig 9. Relative concentration of metabolites in recombinant S. cerevisiae T73-63 supplemented with 10 g/l acetate at 10 h (marked grey) and T73-63 (marked white) at 12 and 16 h.
Values represent the average of three independent cultures, and error bars correspond to the standard deviation (P< 0.05, Student’s t test).

