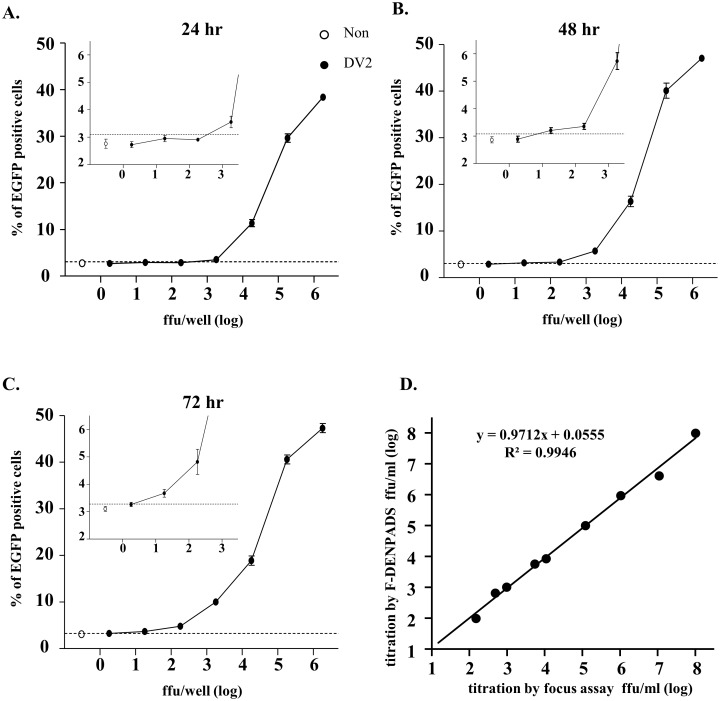
Fig 3. Determination of DENV titers by F-DENPADS.
F-DENPADS cells were seeded in 24-well plates. After incubation for 24 hours, the cells were infected with a 10-fold serial dilution of DENV-2. EGFP expression was examined via flow cytometry 24 (A), 48 (B), and 72 (C) hours after infection. The percentage of EGFP-positive cells versus virus titers is plotted. The hollow dot represents the percentage of EGFP-positive cells in the non-infection group and is defined as the background value. Partially enlarged views between log 0 to 3 FFU/well are presented in the upper-left within the diagram. The data shown are the mean values ± standard deviation obtained from 3 independent experiments. The dotted lines indicate the mean plus a 2-fold standard deviation of the non-infection group. (D) Virus titers of 9 DENV samples were converted by the standard curve that was obtained from F-DENPADS cells incubated for 72 hours (in Fig 3C). Virus titers were determined in parallel by an immuno-focus assay. The correlation between the two methods is shown.

