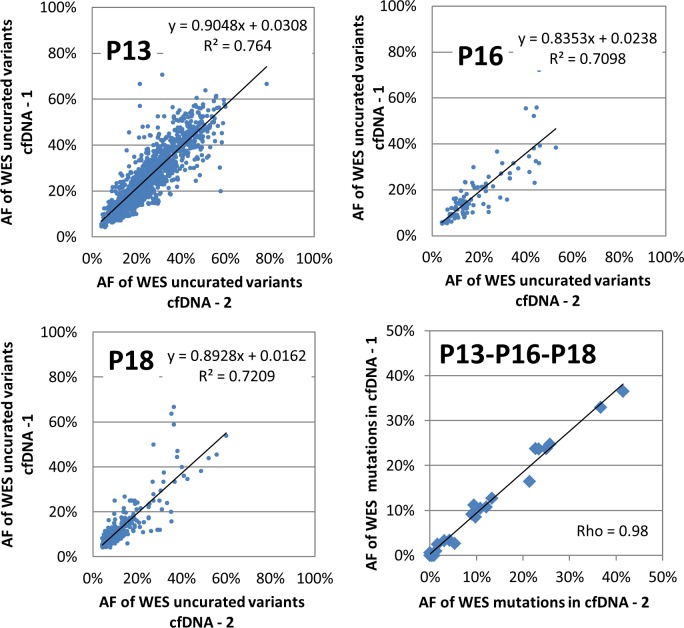
Fig 4. Correlation of variant percentages between duplicate whole exome sequencing of the same cfDNA extract.
All somatic variants in common between each of the three duplicate samples are displayed. Lower right: Correlation of variant frequencies between duplicates for all curated variants (pooled results from patients P13, P16 and P18).

