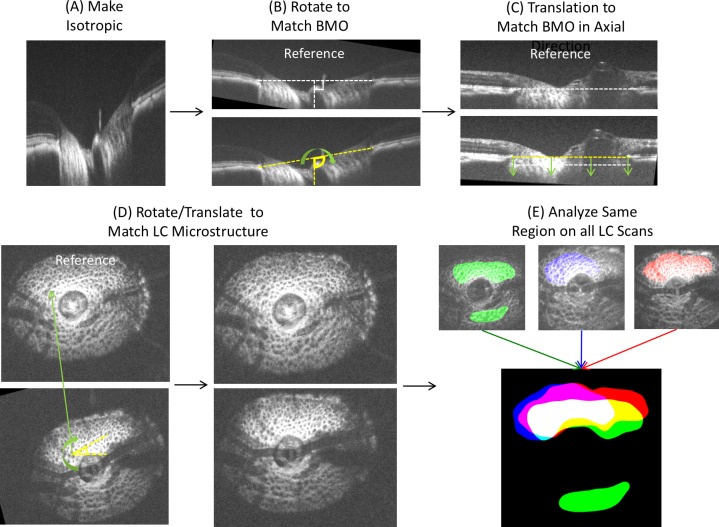
Fig 2. Image analysis procedure.
(A) Images were adjusted for isotropic dimensions, (B) and rotated to match the angle of Bruch membrane opening (BMO). (C) Images were translated in the axial direction to match the axial height of the BMO. (D) The microstructures were aligned manually via 3D rotation and translation. (E) Visible LC was denoted and a common overlapping region (white color region) was used for analysis.

