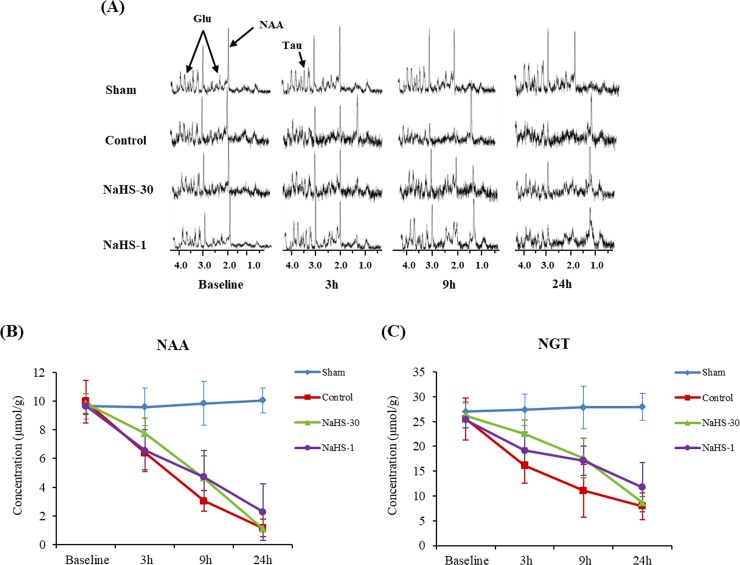
Fig 6. cNAA and cNGT changes in the ischemic core.
(A) MR spectra at baseline and at 3, 9, and 24 h after ischemia. (B, C) The cNAA (B) and cNGT (C) values were plotted against time. The cNAA and cNGT levels decreased over time in the control, NaHS-1, and NaHS-30 groups and reached a similar level at 24 h after I/R modelling in all three groups. The cNAA and cNGT values did not differ significantly between the three groups at any time point.Data are presented as mean ± standard deviation (n = 8 rats in each group).

