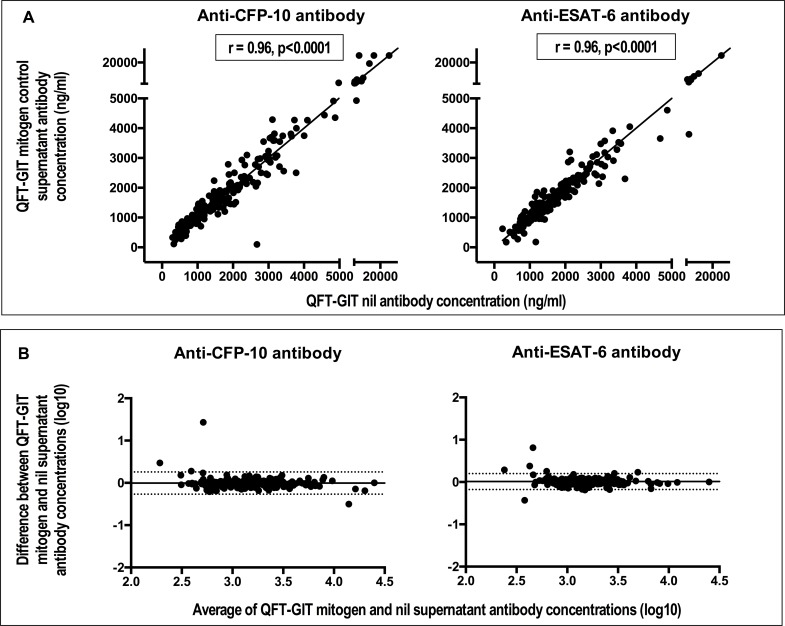
Fig 2. Anti-CFP (culture filtrate protein)-10 & anti-ESAT (early secretory antigenic target)-6 antibody concentrations in QFT-GIT mitogen control supernatants strongly correlate with those in QFT-GIT nil control supernatants and there are no statistical differences between them.
Panel A: scatter plots showing correlation. The coefficient (r) and the p values shown correspond to results from Spearman’s rank correlation. The solid lines are lines of identity. Panel B: Bland Altman plots showing agreement. The solid horizontal line represents the bias or average difference while the dotted horizontal lines are 95% confidence intervals.

