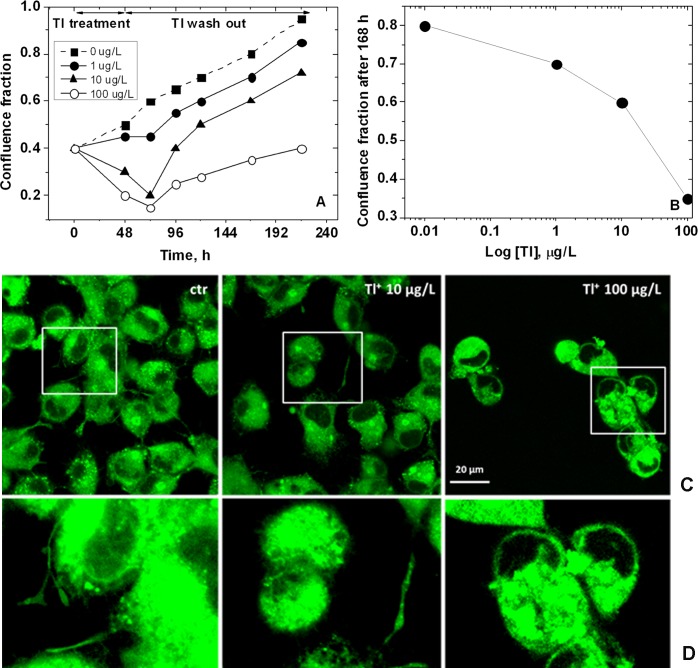
Fig 1.
A) Tl effect on the neuronal growth, measured evaluating the confluence expressed as a fraction of cell population (SD = 2%, N = 3 independent experiments, n = 5 fields 400 x400 μm). B) Confluence fraction 5 days after the treatment vs Tl concentration. C) Morphology of HN9.10e neurons in controls and after 48 h exposure to 10 and 100 μg/L Tl single dose. D) Enlargement of the regions indicated in C, corresponding to control neurons with neurites (left), cells treated with 10 μg/L Tl characterized by the reduction of neurites (center) and cells treated with 100 μg/L Tl with the complete loss of neurites and the alteration of cytoplasm (rigth).

