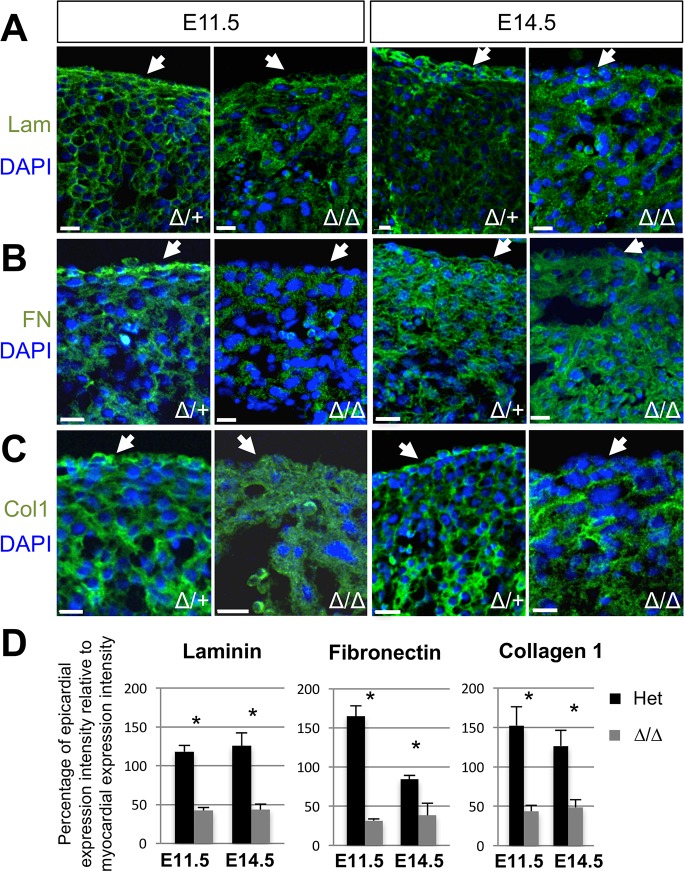
Fig 11. Examination of ECM composition in Myh10∆ control and mutant embryos.
A: Laminin immunofluorescence (green) is present at E11.5 and E14.5 in the Myh10∆ heterozygous ventricular myocardium and is continuously distributed in the epicardium (arrow). Myh10∆ homozygous mutants show reduced laminin immunoreactivity in the epicardium (arrow) at both E11.5 and E14.5. Nuclei are marked with DAPI (blue). B: Fibronectin immunofluorescence (green) is present at E11.5 and E14.5 in the Myh10∆ heterozygous ventricular myocardium and is continuously distributed in the epicardium (arrow). Myh10∆ homozygous mutants appear to have reduced signal, especially in the epicardium (arrow) at E11.5 and E14.5. Nuclei are marked with DAPI (blue). C: Collagen 1 immunofluorescence (green) is present at E11.5 and E14.5 in the Myh10∆ heterozygous ventricular myocardium and is continuously distributed throughout the epicardium (arrow). Myh10∆ homozygous mutants have reduced collagen 1 signal in the epicardium (arrow) at E11.5 and E14.5. Nuclei are marked with DAPI (blue). Genotypes and developmental stages are labeled on the image. D: Quantification of the ratios of expression levels of epicardial immunofluorescence intensity to myocardial immunofluorescence intensity for each protein. Three embryos of each genotype were analysed, with measurements taken from five different areas of three different sections from each embryo. All markers and time points showed a statistically significant reduction (*) in immunofluorescence intensity of the epicardium relative to the myocardium in Myh10∆ homozygous mutants as compared to controls (two-tailed t-test, p<0.05). Ratios of expression for each genotype were compared to each other for each marker and developmental stage. Error bars represent standard deviation. Genotypes, markers and stages are labeled on the graphs. Scale bars: 15 μm. Abbreviations: Lam: laminin, FN: fibronectin, Col1: Collagen I.

