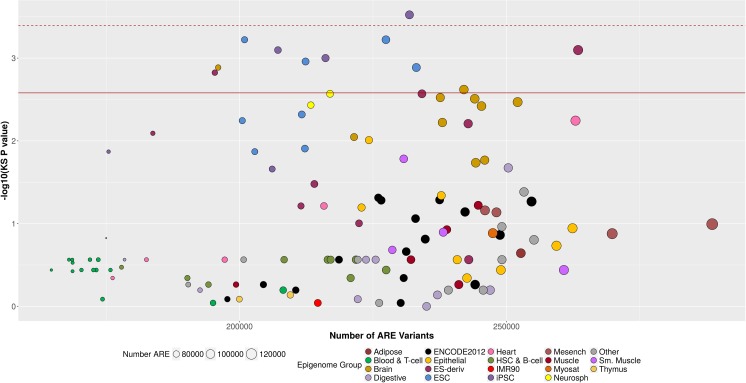
Fig 3. CR-specific ARE enrichment of stronger GWAS CRC p-values.
Each point in this scatter plot corresponds to an enrichment result comparing CR ARE (n = 108,297) to ARE in one of the 124 non-colorectal tissues and cell-types tested. The x-axis shows the number of variants in ARE examined for the corresponding non-colorectal tissue or cell-type (n = 270,030 CR ARE variants). The y-axis is the–log 10 × the p-value from the KS test comparing the distribution of CRC association p-values for variants inside CR ARE versus those inside ARE of a non-colorectal tissue and cell-type. The size of the point corresponds to the number of ARE in the tissue or cell-type. The color of the point represents membership to an epigenomic group, based on a hierarchal clustering of the AREs. In comparison to ARE of digestive tissues (in light purple) and immune cell types (in two shades of green), CR-specific ARE did not exhibit additional enrichment. The strongest enrichment was observed for induced pluripotent stem cells (iPSCs), embryonic stem cells (ESC), and ESC-derived cells, and Brain cell-types. The red dash line corresponds to the Bonferroni p-value threshold correcting for 124 comparisons (0.05/124 = 4 × 10⁻⁴). The red solid line corresponds to the Bonferroni p-value threshold correcting for 19 epigenomic group comparisons (0.05/19 = 3 × 10⁻³).

