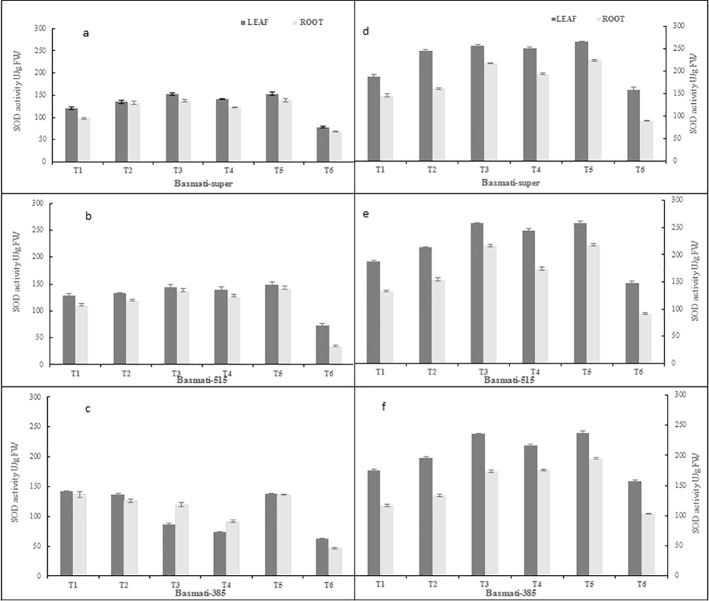
Fig 2. SOD contents in leaves and roots of different rice varieties grown hydroponicaly (left panel a, b, c and pot/soil experiment (right panel d, e,f).
T1 = P.oryzae, T2 = Fungicide +P.oryzae, T3 = Bacillus sp KFP-5+ P.oryzae, T4- Bacillus sp KFP-7+ P.oryzae T5 = Bacillus sp KFP-17+ P.oryzae T6 = untreated. Values are means of three replicates and vertical bars represent the standard error. All treatments are significantly different from each other at P<0.001.

