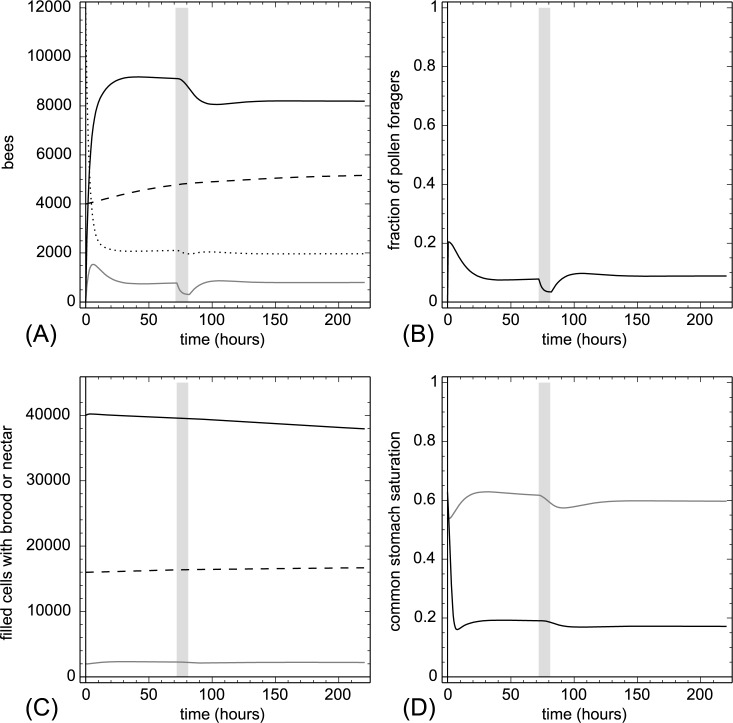
Fig 7. Removal of pollen foragers.
At t = 72 hr we removed 25% of all pollen foragers (Fpollen(t)) in every hour for a period of 10 hours. The grey background indicates treatment. A: dynamics of task groups and open brood: nectar foragers (black solid line), pollen foragers (gray solid line), inactive foragers (dotted line) and open brood items (dashed line). B: dynamics of the fraction of pollen foragers calculated as Fpollen(t)/(Fpollen(t)+Fnectar(t)+1). C: dynamics of pollen stores (gray solid line), nectar stores (solid black line) and sum of open and capped brood (dashed line). D: dynamics of the common stomach saturation: Ω(t) (gray solid line) and Φ(t) (black solid line).

