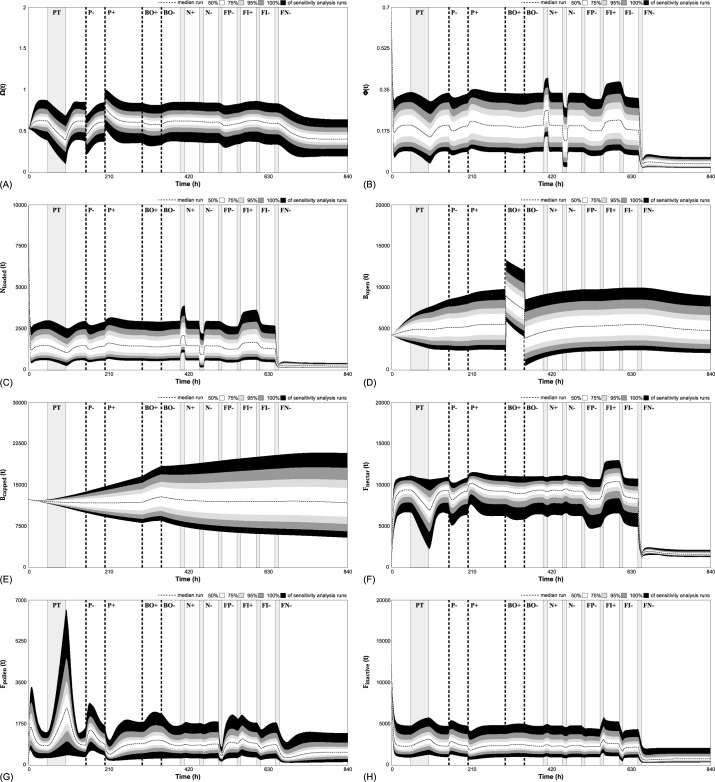
Fig 16. Sensitivity analysis of major system variables Ω(t), Φ(t), and our major stock variables Nloaded(t), Bopen(t), Bcapped(t), Fnectar(t), Fpollen(t), and Finactive(t).
The dotted lines represent the median values of all runs and bands indicate the deviations of runs from these medians (percentiles and quantiles) of runs: white: 50%, light gray: 75%, dark grey 95% and black 100% of all 10,000 runs. See text for the timings and the actual perturbations of the experiments (two-letter codes with “+” or “-”for indicating addition and removal treatments).

