
Figure 2. Murine IFIH1T946 displays increased basal and heightened ligand-dependent signaling in vitro.
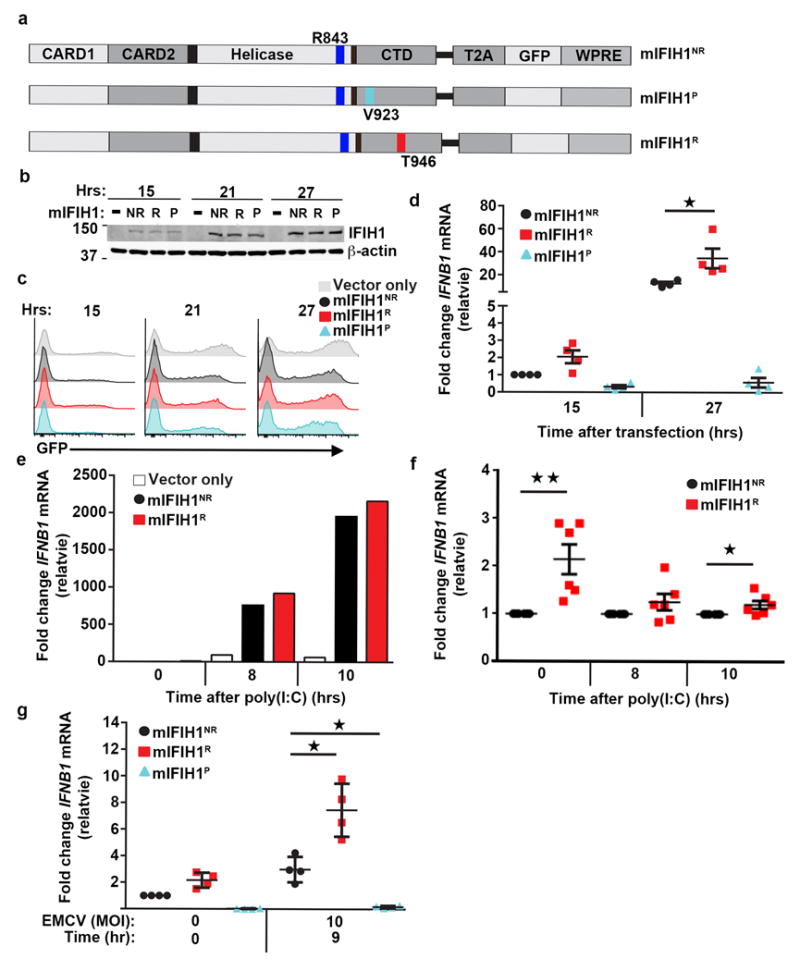
(a) Schematic of murine (m)IFIH1 constructs indicating domains, location of relevant amino-acid substitutions, and T2A-peptide cis-linked green fluorescent protein (GFP) marker. (b-g) HEK293T cells were transfected with 1 μg of plasmid co-expressing either empty vector (vector only) or indicated mIFIH1 constructs for the times indicated. (b) Whole cell lysates were resolved by SDS-PAGE and immune-blotted with indicated antibodies. Blots were cropped for images. (c) Histograms of time course of GFP expression for samples shown in (b). Data are representative of four biological replicates. (d) Quantitative RT-PCR was performed for IFNB1 mRNA expression and results were normalized to the reference gene, HPRT, and subsequently normalized to mIFIH1NR at 15 hrs. Data are displayed as a mean of four biological replicates. (e-f) Transfected cells were stimulated with 1.25 μg of poly(I:C) at 15 hours post-transfection and quantitative RT-PCR was performed for IFNB1 mRNA expression and normalized as in (d). (e) Representative data from one of 6 experiments. (f) Data displayed as a mean ratio of R vs. NR IFNB1 mRNA from six biological replicates. (g) Cells were infected with EMCV at 15 hours post-transfection. Quantitative RT-PCR was performed for IFNB1 mRNA expression and normalized as in (d). Data are the mean of four biological replicates. (d-f) Statistical analysis was performed using a one-way ANOVA (d,g) or one-tail student T test (f). Each data point represents a biological replicate. Error bars represent ± SEM. P=protective (IFIH1V923). *p<0.05, **p<0.01.