
Figure 6. mIFIH1R mediates increased sensitivity to self-RNA ligands.
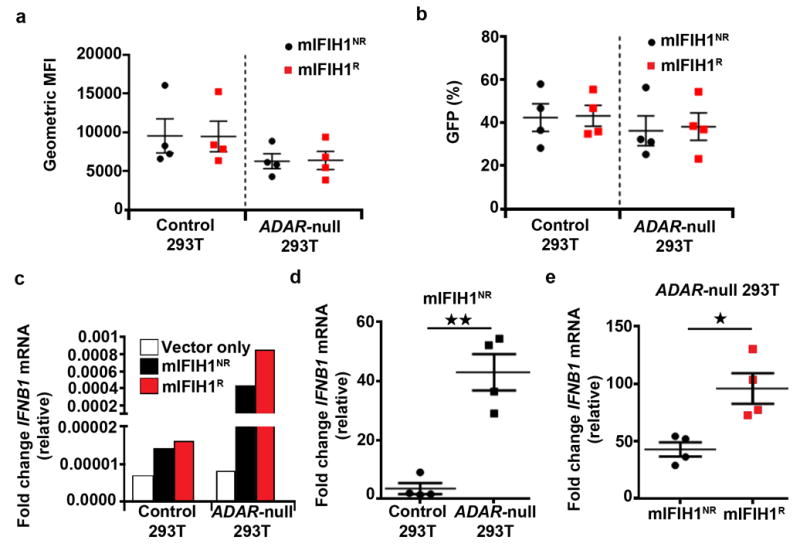
(a-e) Control or ADAR-null HEK293T cells were generated by lenti-CRISPR technology. Cell lines were transfected with 1 μg of mIFIH1 risk or non-risk constructs shown in Fig 2. Cells were analyzed by flow cytometry at 27 hours post-transfection for (a) geometric mean fluorescent intensity (MFI) and (b) percent GFP expression and combined data from four biological replicates are shown. (c-e) Quantitative RT-PCR for IFNB1 mRNA expression in control vs. ADAR-null cells transfected with mIFIH1NR construct. (c) Representative data from one experiment. (d) Combined data from four biological replicates. (e) Relative levels of IFNB1 mRNA expression in mIFIH1NR vs. mIFIH1R transfected ADAR-null cells showing combined data from four biological replicates. Results were normalized by the Livak method as in Fig 2d. Statistical analysis performed using a two-tail student T test. Each data point represents one biological replicate. Error bars represent ± SEM. *p<0.05, **p<0.01.