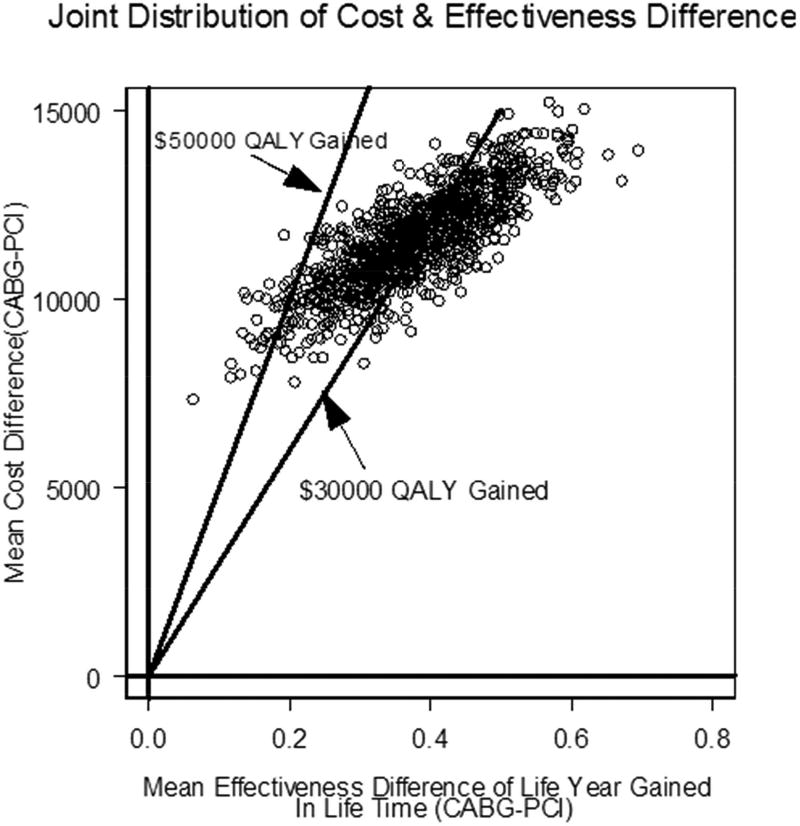
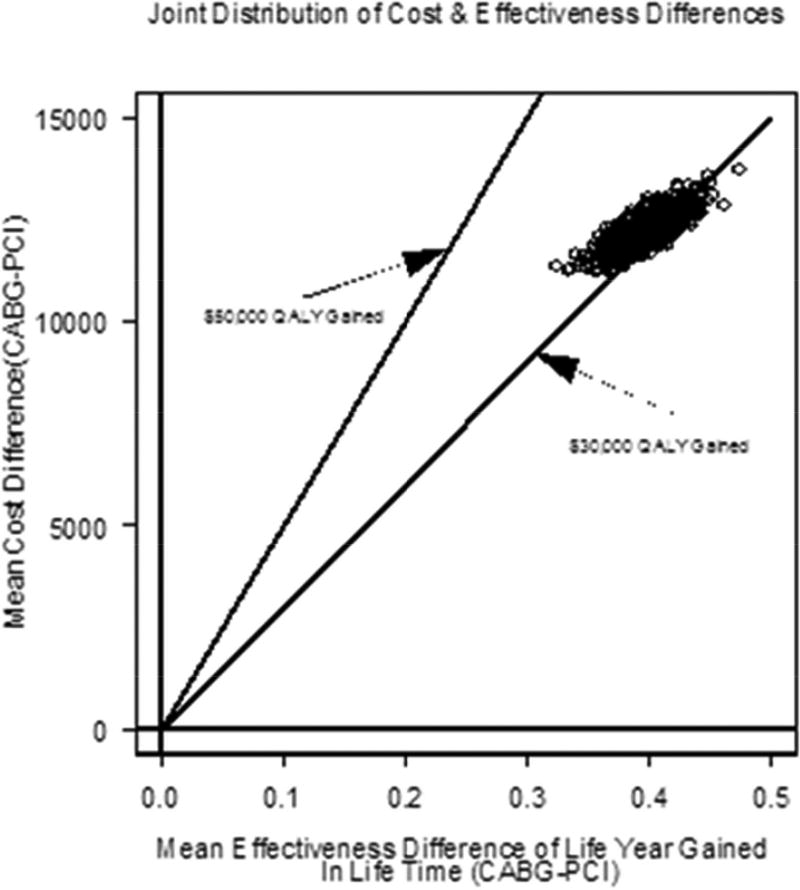
FIGURE 1. Scatterplot of Cost and Effectiveness Differences.
Scatterplot of the joint distribution of cost and effectiveness differences in the cost-effectiveness plane for the lifetime analysis. Results via (A) PSBB adjusted method and (B) the matched analytic population. Abbreviation in Central Illustration.


